Stage-to-stage visibility
Confirm each account journey can be traced from first qualification through implementation and renewal without switching tools or rebuilding context manually.
Real-time visibility into complete customer lifecycle performance—from sales velocity to implementation success to expansion revenue prediction.
Request demoGet comprehensive visibility into how customers progress through sales, implementation, and success stages—plus transparent usage metrics and ROI tracking.
Track sales cycle velocity, implementation completion rates, customer health scores, and expansion opportunity identification across complete customer journeys.
Customer Journey Oracle analytics that predict implementation risk, renewal probability, and expansion potential based on engagement patterns and historical data.
Filterable views connecting sales activity to implementation outcomes to success metrics—export insights or share with stakeholders as needed.
Clear metrics on customer acquisition cost reduction, time-to-value improvement, and net revenue retention increase tied to platform usage.
Intelligence that spans complete customer relationships—predict outcomes, optimize strategies, and prove ROI across your entire customer lifecycle.
Sales velocity, implementation health, success predictions, and expansion opportunities with trend analysis and cohort comparisons across customer segments.
See journey dashboards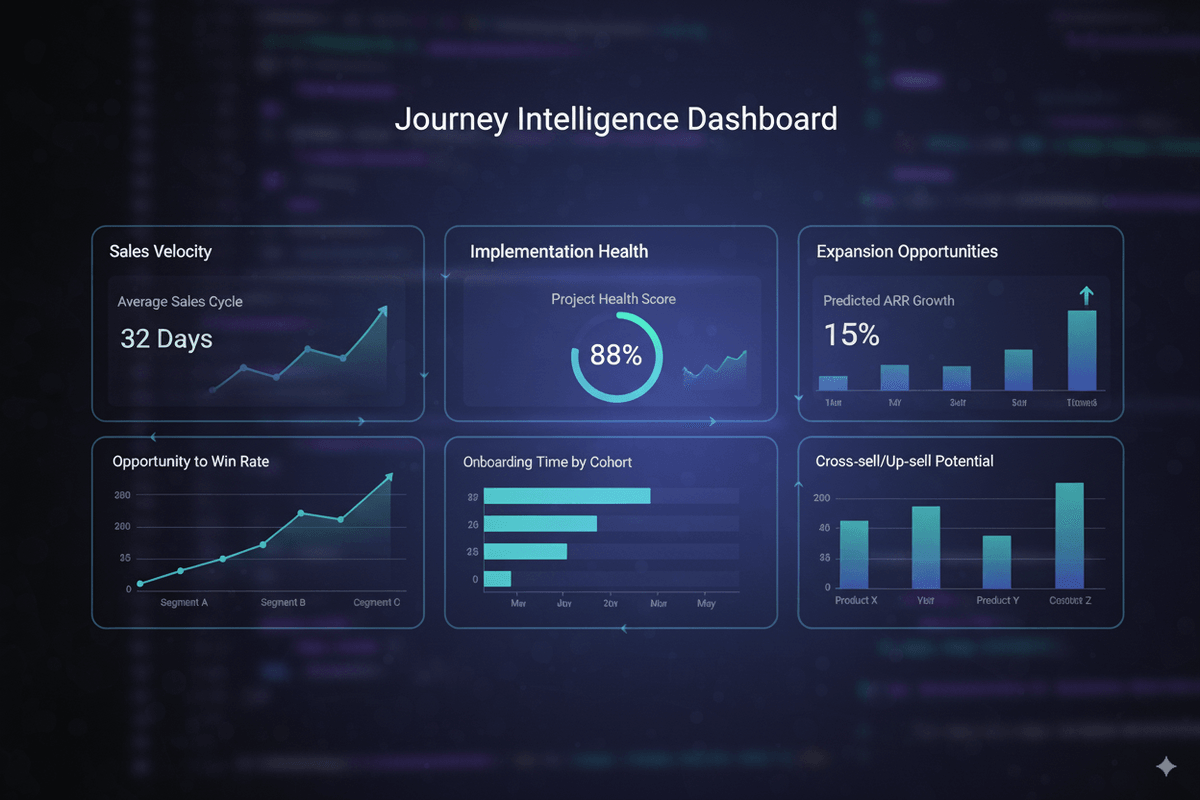
AI-powered insights like "Customers with this engagement pattern achieve go-live 30% faster" and "Similar companies typically expand by $50K in month 8."
Learn about predictive analytics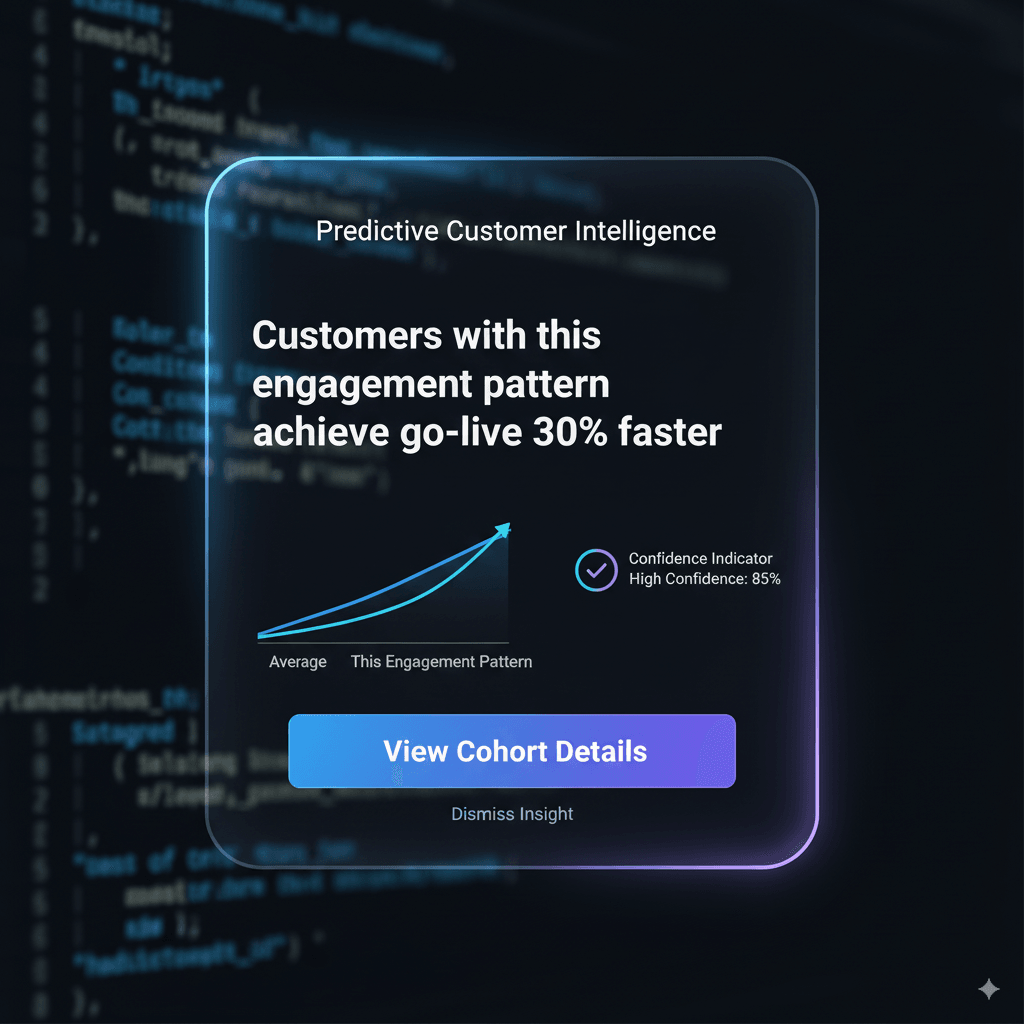
Teams evaluating customer journey analytics software usually fail when they only compare chart counts. The real question is whether reporting helps revenue, onboarding, and success teams make faster decisions with shared context. Use this checklist to verify that your analytics stack supports full-funnel execution rather than isolated snapshots.
Confirm each account journey can be traced from first qualification through implementation and renewal without switching tools or rebuilding context manually.
Validate that dashboards expose leading indicators for churn or stalled onboarding before outcomes degrade, so teams can intervene while recovery is still possible.
Ensure reporting can tie lifecycle actions to commercial outcomes like demo completion, expansion conversion, and net revenue retention impact.
Check that sales, onboarding, and success can all use the same reporting surface to align on customer status, priorities, and next actions.
For complete lifecycle coverage, pair reporting with Sales Collaboration, Customer Portal, and use-case playbooks to connect analytics to execution.
Customer journey reporting works best when analytics connect directly to execution surfaces. These routes extend reporting into onboarding visibility, handoff continuity, and retention intelligence.
Monitor onboarding milestones, task completion, and go-live readiness from a unified reporting surface.
Track deal-room context transfer, stakeholder engagement, and handoff readiness across active opportunities.
Measure portal engagement, content adoption, and customer activation rates across lifecycle stages.
Surface churn risk signals, renewal readiness, and health trends to keep retention execution on track.
Sign up now to experience customer journey intelligence.